


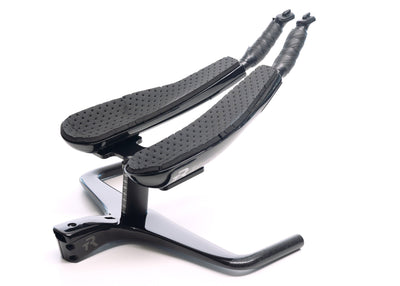
Matt Russell + Omni in the Wind Tunnel

Matt Russell has recently come on board with TriRig as a sponsored athlete. For 2019, he is going to ride basically everything we make. The super-meticulous pro has chosen our products to help make him as fast as possible on the bike, while also keeping him comfortable and fresh for the run. We recently went with Matt to the San Diego Low-Speed Wind Tunnel to refine his position, quantify his gains, and find out exactly what the Omni could do for him that his previous rigs couldn't.
There's lots of stuff to talk about, but before we dive into the data, we need to set the stage a bit. First of all, why do we test in San Diego? There are a few tunnels around the country, and San Diego is definitely not the cheapest. But the price is well worth it. We have been using the San Diego LSWT as our exclusive testing site since 2015. The quality of the facility, its instrumentation, and its staff are simply top-notch. Ultimately, the resulting data is incredibly reliable, repeatable, and robust. More importantly, when we run wind tunnel tests that replicate computational studies we have done with CFD, the LSWT data tends to match our CFD tests very closely. That means we can rely more heavily on CFD during product development, and use the wind tunnel as a final validation of product, or to run studies with an individual rider actually pedaling, something that can't be easily replicated in CFD. The scope of this article is just the testing we did with Matt Russell, his current Omni rig, and his previous Diamondback Serios (the one he raced all of 2018). There were more tests we did during this particular trip, but those will be the subject of a future article. For now, let's talk about the testing we did with Matt. Specifically, our protocol.
Protocol and Presentation

Our test protocol is fairly standard. Wind and wheels both spin at 30 miles per hour. For equipment-only tests, without a rider on board, we tested at 0, 2.5, 5, 7.5, 10, and 15 degrees of yaw. Yeah, we skipped 12.5 degrees, in an effort to save time. Once you're beyond 10 degrees, you're looking at yaw angles that are experienced only a very low percentage of your riding time. Nevertheless, we wanted to sample out to 15, where most parts are starting to stall and drag begins to increase again (after generally going down from 0 to 10 degrees). This is slightly unorthodox, but not unheard of. Sample time was 20 seconds per point.
For tests with the rider on the bike, we tested at 0, 5, 10, and 15 degrees of yaw. Each point was sampled for 40 seconds - sometimes a longer sample is good for riders who move around a bit. But Matt was so still and consistent, we were able to shorten his samples to 40 seconds and still get very stable data.
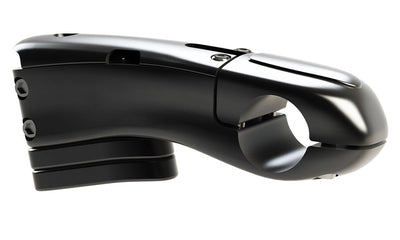
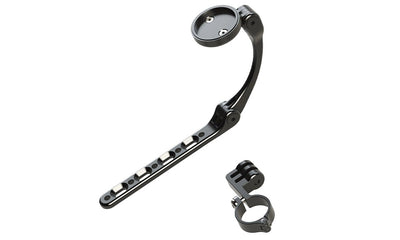
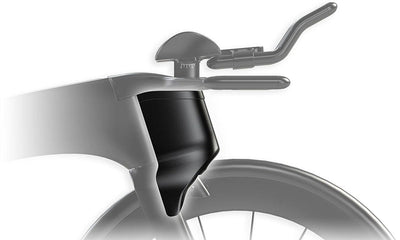
Regarding the equipment, we wanted to test Matt's setup exactly as it was during his race season last year, and compare that to what he will be racing this year. The bikes have the same wheels, saddle, and gearing. The differences include the frameset (Diamondback Serios last year, TriRig Omni this year), the crank (2x Dura-Ace 2x crank on the DB, 1x Metron crank on the Omni), and hydration (TorHans on the DB, and a simple BTA bottle on the Omni). The initial position on the Omni was set to be identical to his position on the Diamondback from last year. When we tested the bikes by themselves (without rider on), we took off the hydration, to try to tease out the differences between the framesets. But with Matt on board, he wanted (and we agreed) to test exactly as he would be racing. As such, this shouldn't be considered a "Serios vs. Omni" test, per se. Because there are a couple more variables than just the frames/cockpits. Really, this is a test of Matt's old racing setup versus his new racing setup. It's a test specific to Matt, but is instructive about how these kinds of trips go. Our goal was to make him faster, not to "prove" anything to the general reader.
But just as important as our setup is Matt's approach to the test. We wanted him relaxed and riding in his typical posture. We didn't want him to strain, tuck more than usual, or do anything he wouldn't find himself actually doing out on a race course. Matt agreed:
"I've done tunnel tests before where the testers asked me to tuck really hard and drop my head, just to help the drag numbers go down for the test. But that's not a position I can actually hold on race day, so it doesn't give me numbers I can actually use. For this test, TriRig just asked me to pedal relaxed, however felt normal. As a result, every position I hit in the tunnel is something I would actually ride in the real world. So I know the numbers represent real time savings."
-Matt Russell
Finally, in presenting our data, we have published both the complete drag plots, as well as weighted-average summaries which are a bit easier to read and digest. We have also published the weight sets used, which represent estimates of real-world wind angle distributions. In the past, we have sometimes used multiple weight sets to represent slightly different riding conditions. But ultimately, the rank order and relative magnitude of the weighted-average results don't move much at all, so this time around we opted for a single weight set, for simplicity. As with any test, the careful reader might find changes they would have made to the protocol, or what kinds of tests they would want to conduct. We always encourage critical reading, and any skepticism or disagreement as to what we have done is perfectly understandable. Ultimately, our goal was to find out whether Matt's move to TriRig was good for him, from an aerodynamic perspective, and how we could tweak his position to make him even faster. The results were a lot of fun to sort through. Ready to see them? Let's hit the jump and pore over some data.


